Projet final
Objectif
Ce projet illustre comment :
charger et manipuler des données
produire des visualisations
créer une carte avec GeoPandas et Cartopy
présenter les résultats de manière reproductible
import pandas as pd
import numpy as np
import matplotlib.pyplot as plt

import geopandas as gpd
import cartopy.crs as ccrs
import cartopy.feature as cfeature
# Données fictives
x = np.linspace(0, 10, 100)
y = np.sin(x)
plt.figure(figsize=(6,4))
plt.plot(x, y, color="orange")
plt.title("Exemple de courbe")
plt.xlabel("x")
plt.ylabel("sin(x)")
plt.show()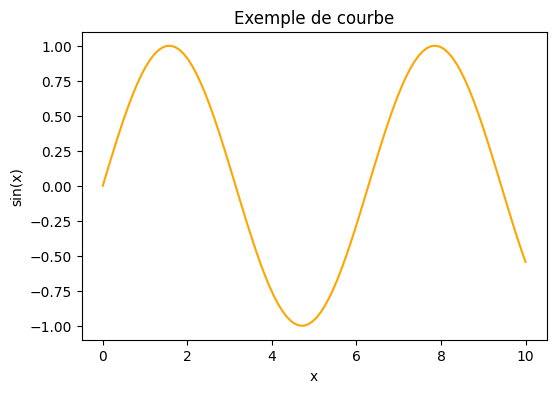
Geopandas
# Charger un dataset
url = "https://naturalearth.s3.amazonaws.com/110m_physical/ne_110m_land.zip"
world = gpd.read_file(url)

# Aperçu
world.head()
Loading...
world.plot(figsize=(10,6), color="peachpuff", edgecolor="black")
plt.title("Carte du monde")
plt.show()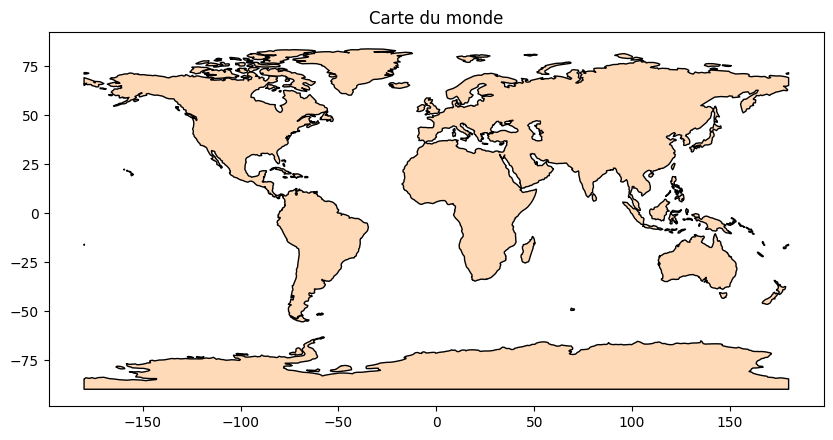
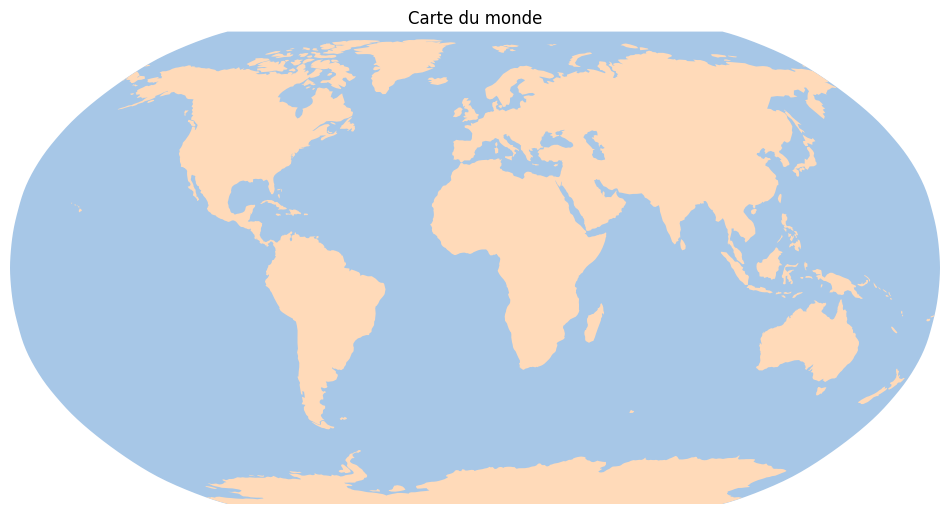
Cartopy
# Créer la figure avec projection Robinson (plus esthétique)
fig = plt.figure(figsize=(12,7))
ax = plt.axes(projection=ccrs.Robinson())

# Fond océan
ax.set_facecolor("#A7C7E7")

# Plot des terres
world.plot(
    ax=ax,
    transform=ccrs.PlateCarree(),
    color="#FFDAB9",
    edgecolor="none"
)

# Supprimer éléments inutiles
ax.set_global()
ax.spines["geo"].set_visible(False)

# Titre
plt.title("Carte du monde")

plt.show()